After a record-breaking sale, we take a look at the 10-year trends in Book 1 of the Magic Millions Gold Coast Yearling Sale to get a picture of how the market has developed over the years.
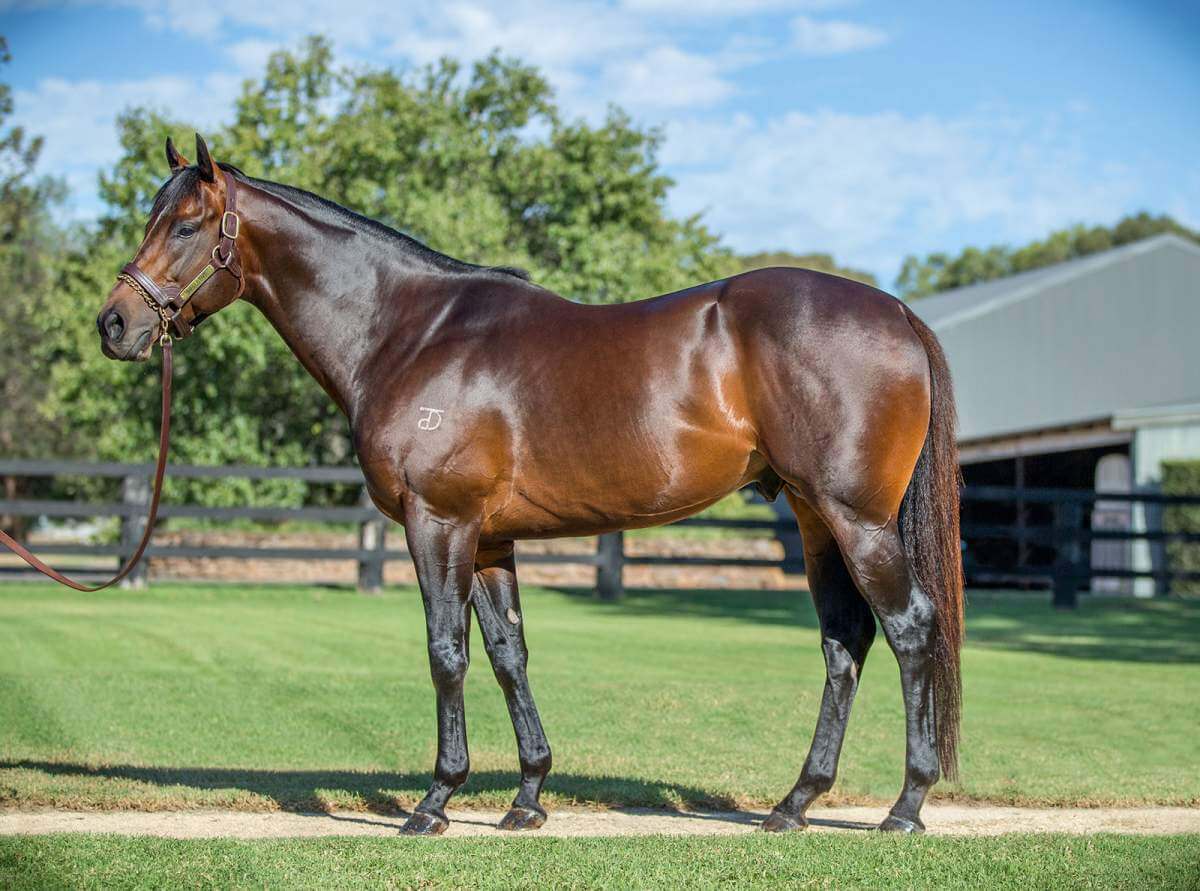
The record for the highest-priced yearling at the sale was broken this year when the Segenhoe Stud-consigned I Am Invincible colt (Lot 606) out of Anaheed (Fastnet Rock) sold to Tom Magnier for $2.7 million.
Regardless of the particular competition over one horse, this kind of result wasn’t an anomaly as the record for the number of seven-figure lots was also broken, reaching 20 in the end. But a glance at the top lots doesn’t provide a full picture. The 2018 sale saw the highest-priced yearling jump to $2 million, double that of the 2014 sale, but until this year it hadn’t reached the same mark again. Meanwhile, the average had climbed steadily all along, more than doubling from just over $140,000 in 2014 to a little over $290,000 in the last two years.
Lot 606 – I Am Invincible x Anaheed (colt) was purchased for $2.7 million by Tom Magnier | Image courtesy of Magic Millions
Stepping away from the headlines and taking a more objective view of the results can provide some insight into how the sale has changed over the years.
A market adjustment
Whilst the average at this year’s sale remained almost exactly the same as last year’s, the median was down $20,000 to $210,000. The median – a metric which mutes the influence of results at the extreme ends – had grown steadily from $120,000 in 2014 to break $200,000 for the first-time last year.
Median Price
Chart: The median price at the Magic Millions Gold Coast Yearling Sale
A subtle change might not be a cause for concern for the market, but a dive into what’s changed throws up some thought-provoking points.
A great way to assess the dynamic of a sale in more depth is to break up the results as ordered by descending price. Not only does this account for a growth in the numbers sold in the past decade (537 in 2014 up to 785 this year), unlike averages it tells you how strong each section of the market is.
The results are telling. Over the past 10 years the average price of the most expensive 25 per cent of horses sold (i.e., the top quarter of the market) has climbed steadily every year, from $269,319 to $629,644. This more than doubling reflects the increasing price of the annual sale-toppers, and it’s safe to conclude that the top end of the market has shown unabated growth.
Over the past 10 years the average price of the most expensive 25 per cent of horses sold has climbed steadily every year, from $269,319 to $629,644 | Image courtesy of Magic Millions
The remaining three quarters of the market had followed an almost identical pattern of growth, that is until 2021 when prices stalled against 2020 levels. No medals for guessing which factor was at play there.
In 2022 that three-quarters of the market jumped significantly compared to previous growth. For example, the average of the cheapest 25 per cent of horses in the sale grew steadily from just over $50,000 in 2014 to approach $77,000 in 2020. After it stalled a year, it then jumped up to over $105,000 in 2022.
Top-end average price
Chart: The average price amongst the most expensive 25 per cent of horses at the Magic Millions Gold Coast Yearling Sale
The market flourished in a way not seen before and may go some way to explaining the extraordinary 93.68 per cent clearance rate last year, which this year returned to a more typical 89.74 per cent.
Meanwhile, remember there was no such stalling in growth in the top 25 per cent, supporting the common adage that the top end of the bloodstock market is largely unaffected by extreme world events.
So, whilst the top end grew again this year, the lower three-quarters all experienced a drop. This was most significant in the lowest quarter, which dropped almost $23,000 to an average of $92,229. But, if you count the exceptional results in 2022 as an anomaly, that figure is a typical progression of the market over the last decade.
This dive into quartiles suggests that, whilst the top end has continued to grow, this year the rest of the market was ‘adjusting’ back its normal rate of growth, having climbed at an unusual rate into 2022.
Colts vs fillies
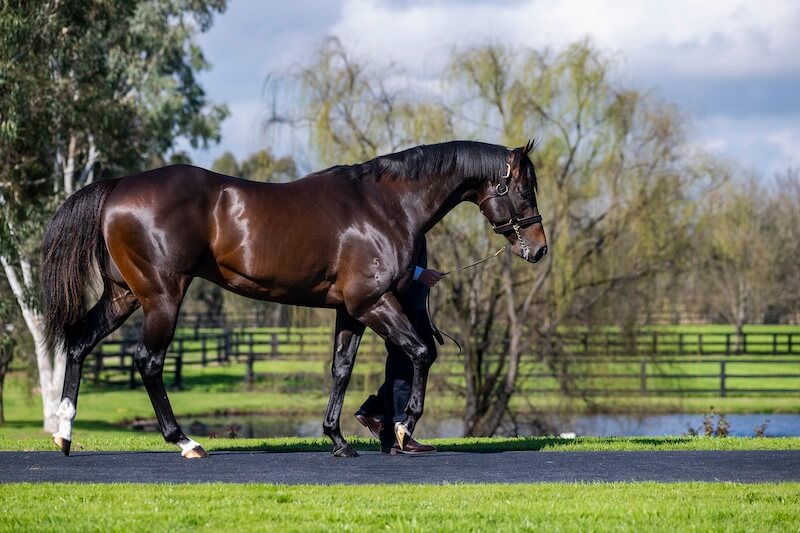
A new record for the highest-priced yearling filly was also set this year when the Zoustar yearling (Lot 399) out of Solar Charged (Charge Forward) sold from Widden Stud to Yulong for $2.6 million.
Lot 399 – Zoustar x Solar Charged (filly) was purchased for $2.6 million by Yulong | Image courtesy of Magic Millions
One comment which arose from this year’s sale was how well fillies did, selling for an average of $289,635 compared to the colts’ $295,648. In the last two years the gap has closed considerably from the general trend (see graph below).
But in general colts have always been more expensive than fillies and, again, breaking up the market shows that it’s the top 25 per cent who drove the trend. This year, the average price of a colt in that bracket was 6.4 per cent higher than for a filly, which is almost exactly the same for the cheapest 25 per cent of horses.
That compared to the most extreme year, 2019, which saw the top colts sell for over 20 per cent more than the fillies, whilst colts in the cheapest bracket sold for only 1.2 per cent more. This year was the first time the gap was truly negligible, and is perhaps a reaction to the ever strengthening mares market.
Colts’ premium
Chart: The average premium paid for a colt at the Magic Millions Gold Coast Yearling Sale
Concentration of power
Whilst the number of horses sold in Book 1 has increased by 46 per cent in 10 years, the number of different sires represented in the top quarter of the market has increased only by 10, to 62 individual sires this year (up 19 per cent), with a similar trend seen across the whole of Book 1.
Does this reflect a honing in on a smaller number of popular sires? Whether this concentration is driven by the sales company, the buyers or the breeders is difficult to tell, however it’s interesting to note that in that time the number of stallions standing in Australia has reduced from 794 from the crop that were sold at the Gold Coast in 2014 to 524 a decade later (down 34 per cent). In that time the number of live foals has dropped only 15.6 per cent to 12,666.
Whilst one sale, and a premium one at that, is too narrow to draw conclusions, the general trend across Australia is something we’ve covered before in TDN AusNZ.
Click here to read about stallions poised to make an impact this season
One thing that is clear is that the number of buyers signing for the most expensive horses has increased remarkably over the last decade, and it’s surely a sign of a healthy industry that the same trend is seen across the market, with 358 buyers in 2023 up from 205 in 2014.
Number of top-end buyers
201420152016201720182019202020212022202304080120160Number of buyers in top 25 per cent
- Number of buyers in top 25 per cent
Chart: The number of buyers represented in purchasing the top 25 per cent of horses at the Magic Millions Gold Coast Yearling Sale
Magic Millions Gold Coast Yearling Sale (Data source 17/1/2023)
Article | TDNAUSNZ – Oz Wedmore